DESIRE was a five years integrated research project funded by the European Commission, initiated in 2007.
The main objective of the project was to establish promising alternative land use and management conservation strategies in areas affected by land degradation and desertification, based on a close participation of scientists with stakeholder groups in 17 selected study sites around the world. Based on this main objective, an effort has been made to analyze a large number of existing indicators related to land degradation and desertification and to derive a minimum number of effective indicators for defining land desertification risk and assessing various land management practices for combating desertification.
Defining candidate indicators
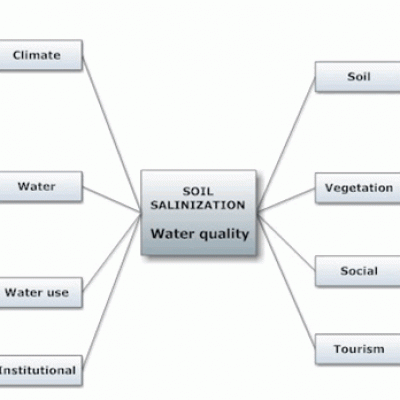
The most important processes or causes of land degradation have been identified: (a) soil erosion including water, tillage and wind erosion, (b) soil salinization, (c) water stress, (d) forest fires, and (e) overgrazing. The next step was to select related indicators to the defined processes or causes by: (a) reviewing literature, (b) consulting stakeholders, and various groups of the DESIRE project, and (c) using previous research. In this regard, a series of 72 candidate indicators related to the physical environment, social, economic, and land management characteristics were analysed and classified based on existing classification systems. Weighing indices have been assigned to each class and separate questionnaires have been formulated to collect the pertinent data in each study site.
Data have been collected in 1672 field sites located in 17 Mediterranean and eastern Europe, Latin America, Africa, and Asia study sites. Specifically, data were collected from the following study sites (Fig. 2): (1) Rendina Basin Basilicata-Italy, (2) Nestos Basin Maggana-Greece, (3) Crete-Greece, (4) Mação- Portugal, (5) Gois–Portugal, (6) Guadalentin Basin Murcia-Spain, (7) Konya Karapinar plain-Turkey, (8) Eskisehir Plain-Turkey, (9) Novij Saratov-Russia, (10) Djanybek-Russia, (11) Zeuss Koutine-Tunisia, (12) Boteti Area-Botswana, (13) Santiago Island-Cape Verde, (14) Mamora Sehoul-Morocco, (15) Loess Plateau-China, (16) Secano Interior-Chile, and (17) Cointzio catchment-Mexico.
Analysis of data
All collected data were classified according to land degradation processes or causes and land uses. The number of candidate indicators used for the analysis in each process or cause was ranged from 16 to 49. The data base has been improved for missing values for some indicators following the appropriate statistical methodology (Steel, et al., 1997)
An empirical approach was adapted to define desertification risk based on the type of environmentally sensitive area (ESA) to desertification (Kosmas et al., 1999) and on the main process or cause of degradation identified for each site. The type of ESA has been used to characterize the present stage of land degradation, in combination with the degree of soil erosion or water stress, etc., thus the risk of land desertification has been assessed. For example, an area characterized as fragile to desertification will be subjected to high desertification risk under very severe erosion or low risk under slight erosion.
After creating the appropriate data basis, the obtained data were analysed in order to define: (a) the interrelationships between various indicators, and (b) the effectiveness of each indicator to evaluate the sensitivity to desertification. A forward stepwise statistical analysis was conducted for all indicators corresponding to each process or cause of land degradation and the sensitivity of each indicator to desertification risk was identified. The analysis was conducted with dependent variable the desertification risk and independent variables all the indicators assigned for each process or cause using the following linear model (Steel, et al., 1997):
Υ = β0 + β1Χ1 + β2Χ2 + …………. + βκΧκ
Where: Y is the dependent variable of desertification risk, β0 is the Υ intercept, β1, β2, etc. are slopes of the regression plane, and X1, X2, etc. are the independent variables of the indicators used. In each pair of indictors which was proved to have high correlation, one of them was usually excluded from the analysis of variance. As an example of the derived algorithms for assessing desertification risk index (DRI) in areas where the main process of land degradation is water stress follows:
DRI = 0.316xRS + 0.194xGE + 0.194xSG - 0.110xDA - 0.107xIS - 0.139xFR = 0.194xSEC - 0.442xRLA + 0.028xWS + 0.313xTC + 0.108xPD + 1.096xPI
Where: RS is the rain seasonality, GE is the rate of ground water exploitation, SG is the slope gradient (%), DA is the rate of deforested area (% per year), IS is the rate of impervious surface area (ha per 10 km2 of territorial surface per 10 years ), FR is the fire frequency (years), SEC is the soil erosion control (area protected per total area, %), RLA is the rate of land abandonment (ha per 10 years per 10 km2) , WS is the water scarcity (water available supply per capita / water consumption per capita during the last 10 years), TC is the tourism change (number of overnight stays in a specific destination over one year / average overnight stays in the last 10 years, %), PD is the population density (people per km2), PI is the policy implementation of existing regulations for environmental protection.


